
PSK Reporter, www.pskreporter.info/pskmap.html, is a powerful tool for monitoring your
FT8, JT65 or PSK signals around the world. But, even if you are not transmitting on any
of these modes it can still be a great propagation tool for determining which bands are
open and to where in the world signals from your area are being heard.
FT8, JT65 or PSK signals around the world. But, even if you are not transmitting on any
of these modes it can still be a great propagation tool for determining which bands are
open and to where in the world signals from your area are being heard.
Here are some instructions with screenshots to get you started:
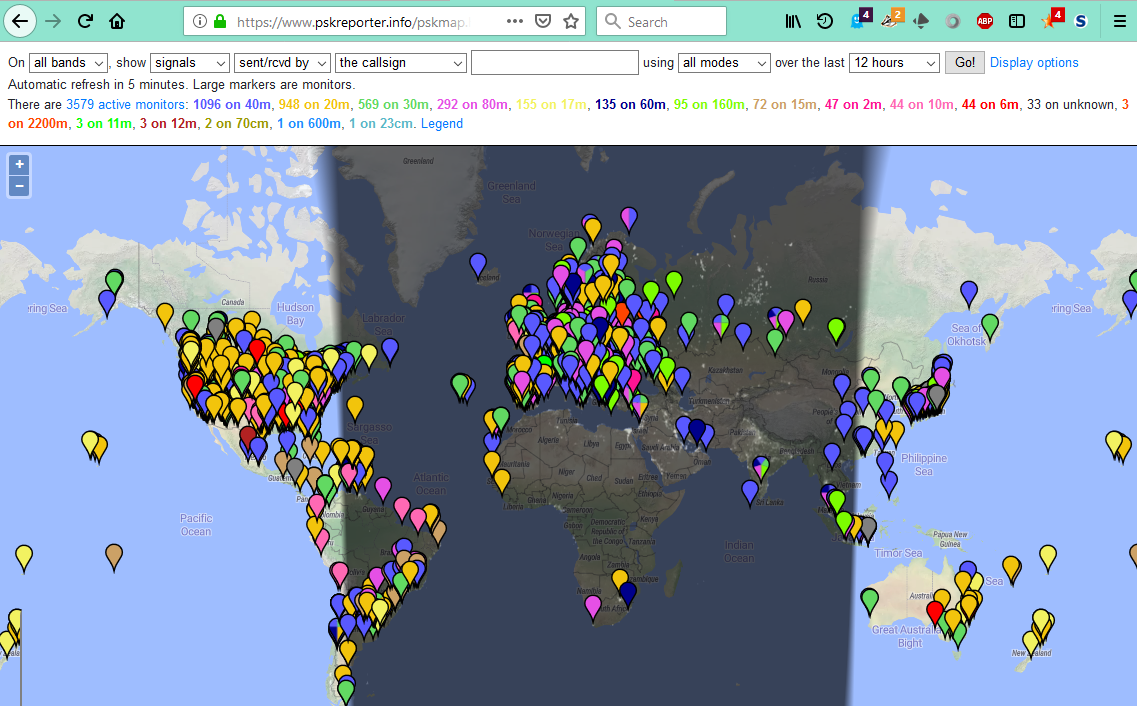
- Go to the PSK Reporter website- www.pskreporter.info/pskmap.html
- A map of the world will appear.
- You will see shading indicating night and day conditions around the world.
upper left corner, double-clicking on an area or using your mouse’s scroll wheel.

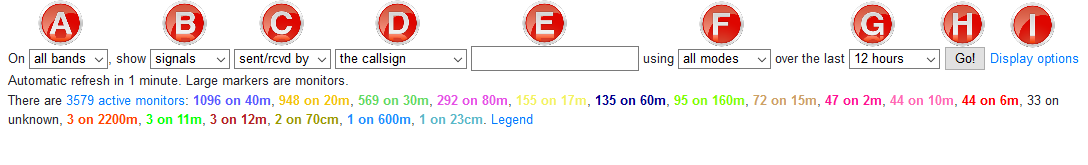
- The controls for what you want to display are across the top of page:
- On- choose “all bands” or select specific band you want to display
- Show- leave this on “signals”
- Sent/Rcvd- choose...
- “sent/rcvd by” if you are transmitting digital signals,
- “sent by” if you are looking for a specific station that is transmitting on digital modes
- “rcvd by” if you are not transmitting digital modes.
- Who- choose…
- “the callsign” to see your stations activity or another specific ham (only if you/they are transmitting digital signals)
- “country of callsign” to see who is transmitting and who is receiving QSOs from a specific country, not a specific callsign (only the country of that callsign)
- “Grid square” to see who is transmitting and who is receiving QSOs from a specific Grid Square (usually your’s)
- “Anyone” this will give you an idea of all activity worldwide (typically only used for one band at a time)
- Callsign or Grid Square- this is where you would enter callsign or grid square depending on what you choose for D.
- Using- this is where you select “all modes” or a specific mode type usually you can leave this as “all modes”
- Over the last- this is where you choose the time frame you want to view from 24 hours to 15 minutes
- Go- once you have made all of your choices in A-G click Go to display the information
Display Options- allows you to set additional parameters
- Examples
- To see all the stations around the world that are hearing my FT8 transmissions
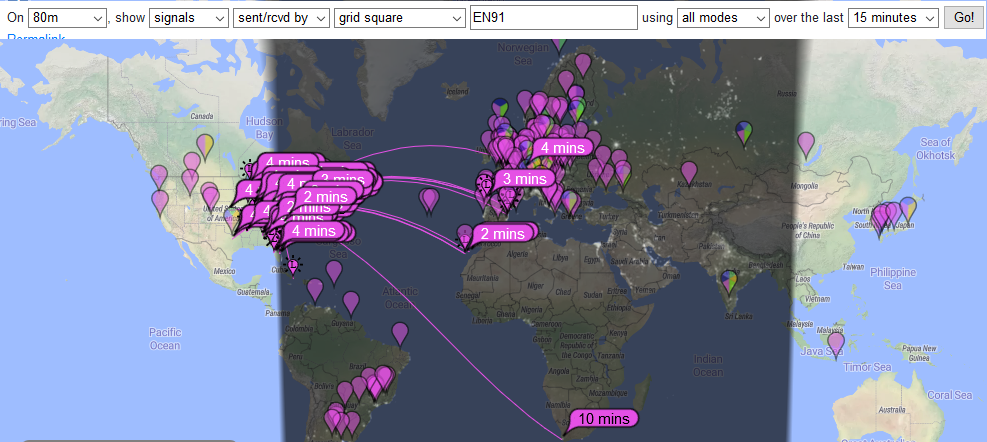
- To see all stations that are receiving digital transmissions from my Grid square on 80 Meter band, even when I am not transmitting
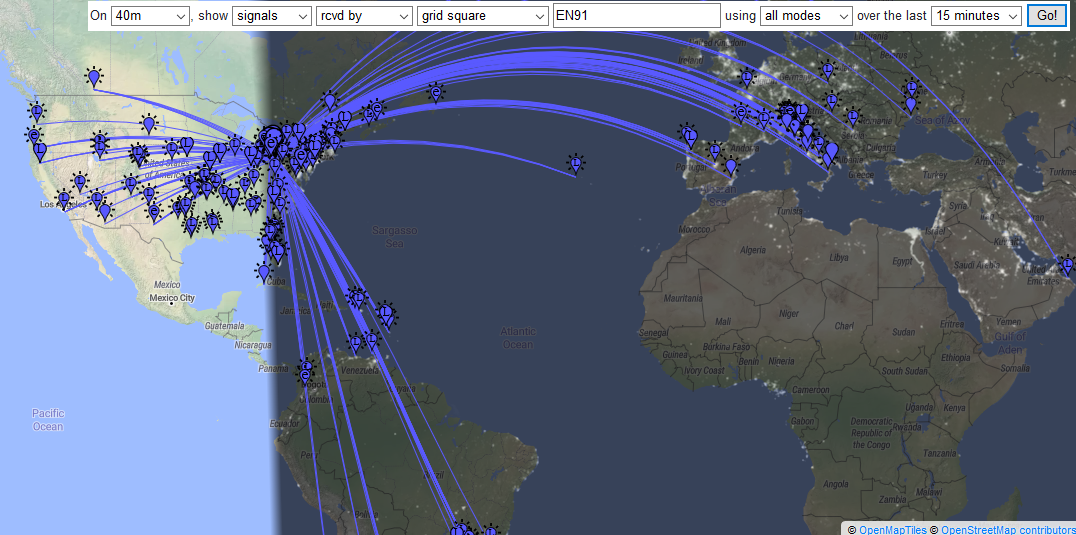
- To see all of the stations that stations in grid EN91 are hearing on 40 meters
- When I am displaying all signals sent & received by me I can click on a colored station “flag” that heard me and see details including the strength of my signal (-6dB here). The colors of the “flags” correspond to color codes for each band as displayed below options section and time in minutes since last heard is shown on each “flag”
No comments:
Post a Comment